
Welcome to the SIMBAD renal cell cancer data
In the SIMBAD project, the ETH
Zurich provides cancer data to evaluate and test appropriate
algorithms. This dataset can be downloaded on this site.
Renal Cancer Images
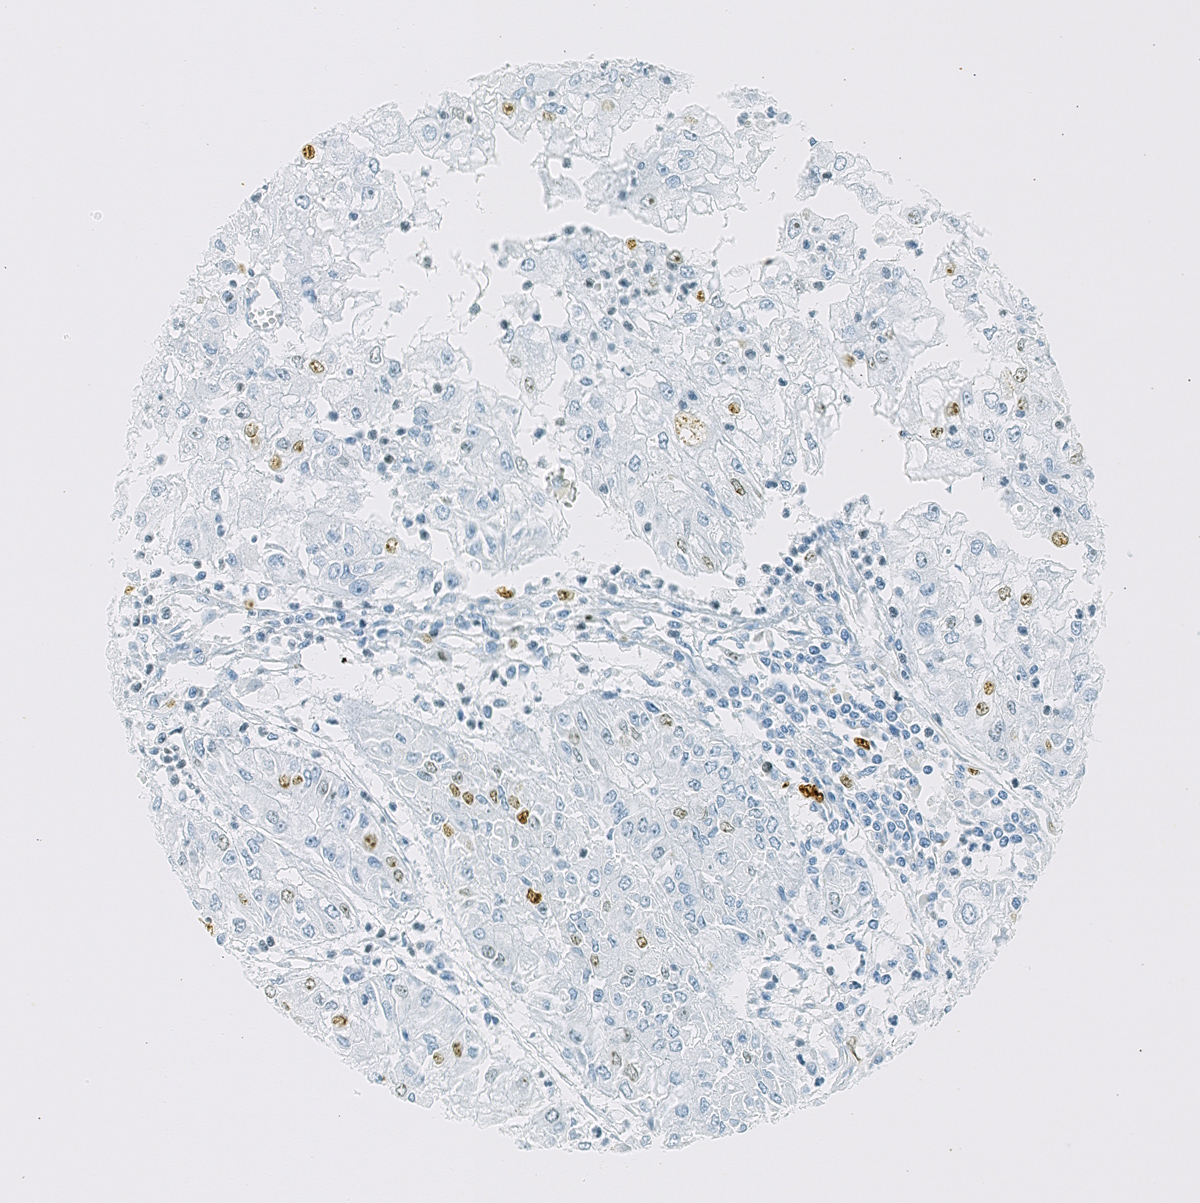
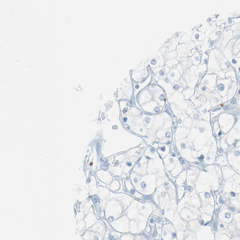
Here, 133 tissue microarray (TMA) images are stored as .jpg,
approx. 3000x3000 px in size, each. The TMAs show several hundreds of
cells, each. They are stained for protein MIB-1, a protein which is
present in cell nuclei of dividing cells. Some cancer cells may be
positive for MIB-1 (brown spots), some negative (blue spots). Also,
healty cells may be positive or negative for this protein (also brown and
blue). The TMAs are also stained with a blue color that shows the cell
nuclei of the cells.
Labeled Images
Pathologists
would look at such TMA images to diagnose and grade the cancer by means of
nucleus shape, cell shape, estimate of stained nuclei. Cancer nuclei
tend to be larger, bulky and unsharp. Moreover, cancer cells tend to
devide more often.
In the folder "Labels", 25 .tif and .svg files show
hundreds of labeled cell nuclei of either hematoxylin and eosin (HE) stained or MIB-1 stained
TMAs. The MIB labeling was done by two pathologists for the same TMA
images. They drew an octagon around the nucelei and labeled it for cancerous or
non-cancerous. Note that the octagons are
not the exact shape of the nuclei, and that the two pathologists
labeled several nuclei differently. Even for them, it's not
absolutely clear which cell is cancer or not.
Nevertheless,
it would be a tremendous progress in cancer detection and treatment to
automate the nucleus detection, shape regognition, tumor
classification and finally the tumor grading of the entire TMA spot by
cancer cell estimation.
In the SIMBAD context, it is a huge challenge to find similarity
measures between images of cell nuclei. The information of cancer or
non-cancer might be hidden in the non-metric similarity of cell/nucleus
shapes.
Example images (downscaled) are:
Patches
From the labeled MIB-1 cell images, we extracted
patches (80x80px .tif images) showing one cell nucleus per patch in
the middle. Each
patch is named with the TMA id, nucleus id within the patch, label of
pathologist 1 and label of pathologist 2. Note that only those
nuclei were collected in the patches that both pathologists identified
as a nuleus (i.e. labeled it). Note further, that both pathologists
might give a different label for one patch.
Histograms are also calculated for the grayscaled MIB patches and added in the folder "Histograms".
The histogram file has following format: the first column lists the
patient id (i.e. TMA id). The second column is for the nucleus id (consecutive
number per patch). The third and fourth columns give the label of
pathologist 1 and 2 for this patch. Columns 5 to 68 show the 64-bin
histogram, one histogram per row.
Finally, in the folder "Code", some matlab
code can be found to generate the patches and to generate the
histograms. To compare histograms and to set up a dissimilarity matrix,
additional code would be necessary.
Example patches:


contact: peter.schueffler@inf.ethz.ch
|